Regression Plots
Seaborn has many built-in capabilities for regression plots, however we won’t really discuss regression until the machine learning section of the course, so we will only cover the lmplot() function for now.
lmplot allows you to display linear models, but it also conveniently allows you to split up those plots based off of features, as well as coloring the hue based off of features.
Let’s explore how this works:
import seaborn as sns
%matplotlib inline
tips = sns.load_dataset('tips')
tips.head()
| total_bill | tip | sex | smoker | day | time | size | |
|---|---|---|---|---|---|---|---|
| 0 | 16.99 | 1.01 | Female | No | Sun | Dinner | 2 |
| 1 | 10.34 | 1.66 | Male | No | Sun | Dinner | 3 |
| 2 | 21.01 | 3.50 | Male | No | Sun | Dinner | 3 |
| 3 | 23.68 | 3.31 | Male | No | Sun | Dinner | 2 |
| 4 | 24.59 | 3.61 | Female | No | Sun | Dinner | 4 |
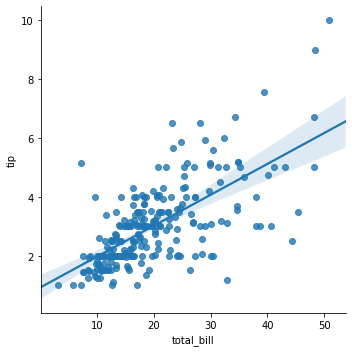
lmplot()
sns.lmplot(x='total_bill',y='tip',data=tips)
<seaborn.axisgrid.FacetGrid at 0x7f62f3a8d588>
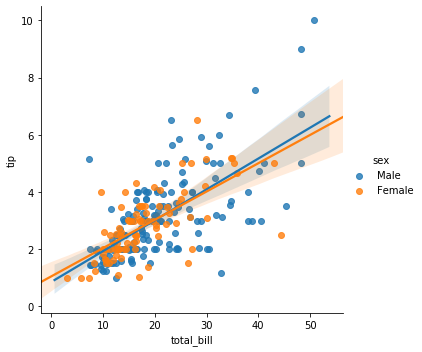
sns.lmplot(x='total_bill',y='tip',data=tips,hue='sex')
<seaborn.axisgrid.FacetGrid at 0x7f62f19f72b0>
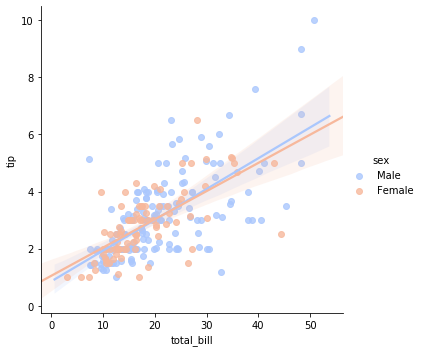
sns.lmplot(x='total_bill',y='tip',data=tips,hue='sex',palette='coolwarm')
<seaborn.axisgrid.FacetGrid at 0x7f62f12adf60>
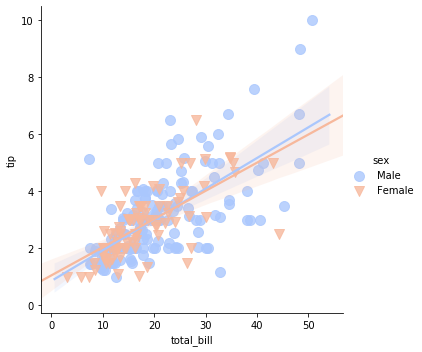
Working with Markers
lmplot kwargs get passed through to regplot which is a more general form of lmplot(). regplot has a scatter_kws parameter that gets passed to plt.scatter. So you want to set the s parameter in that dictionary, which corresponds (a bit confusingly) to the squared markersize. In other words you end up passing a dictionary with the base matplotlib arguments, in this case, s for size of a scatter plot. In general, you probably won’t remember this off the top of your head, but instead reference the documentation.
# http://matplotlib.org/api/markers_api.html
sns.lmplot(x='total_bill',y='tip',data=tips,hue='sex',palette='coolwarm',
           markers=['o','v'],scatter_kws={'s':100})
<seaborn.axisgrid.FacetGrid at 0x7f62f1230128>
Using a Grid
We can add more variable separation through columns and rows with the use of a grid. Just indicate this with the col or row arguments:
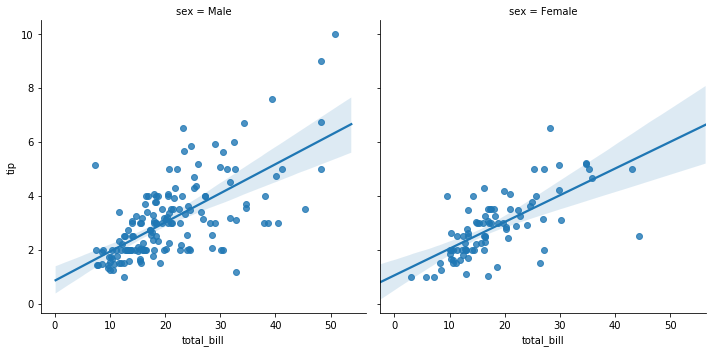
sns.lmplot(x='total_bill',y='tip',data=tips,col='sex')
<seaborn.axisgrid.FacetGrid at 0x7f62f11b45f8>
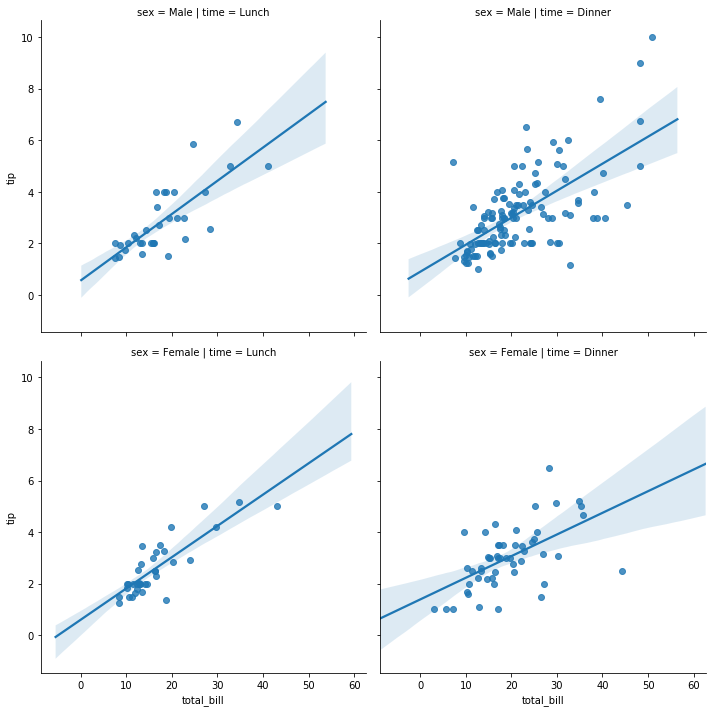
sns.lmplot(x="total_bill", y="tip", row="sex", col="time",data=tips)
<seaborn.axisgrid.FacetGrid at 0x7f62f1155fd0>
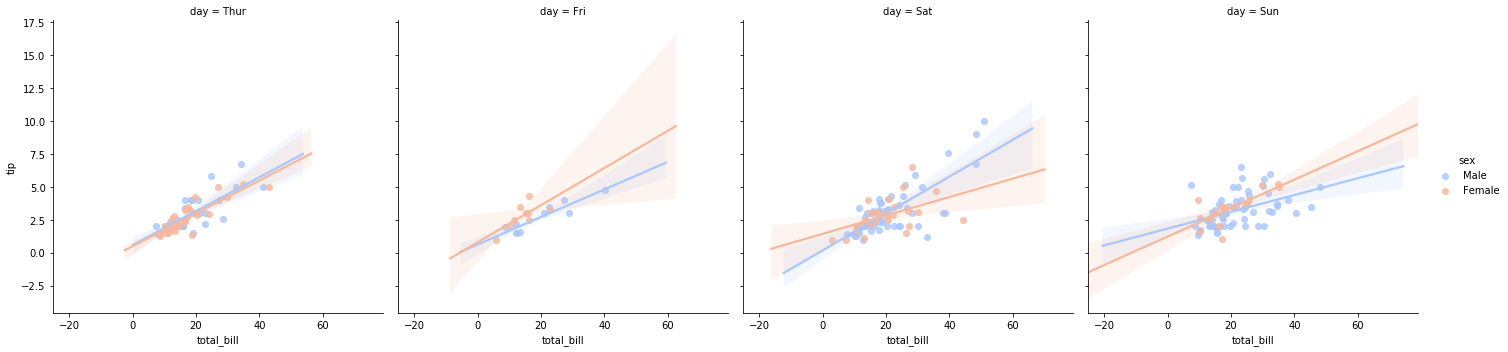
sns.lmplot(x='total_bill',y='tip',data=tips,col='day',hue='sex',palette='coolwarm')
<seaborn.axisgrid.FacetGrid at 0x7f62f0dbe0f0>
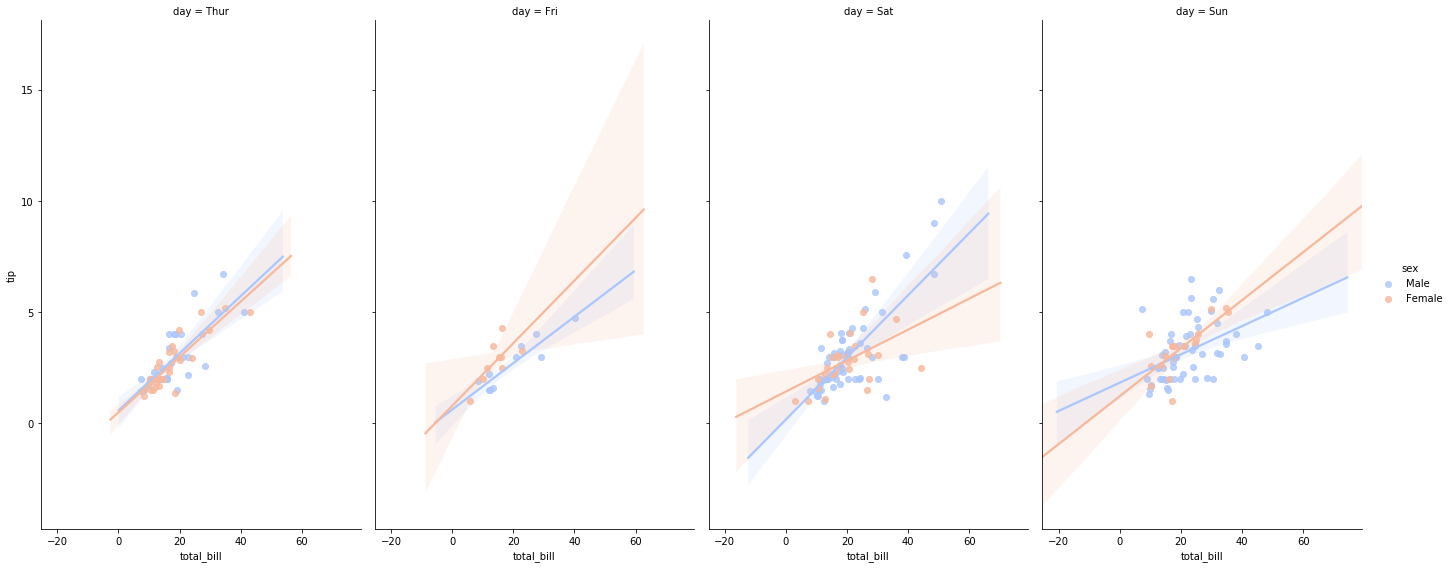
Aspect and Size
Seaborn figures can have their size and aspect ratio adjusted with the size and aspect parameters:
sns.lmplot(x='total_bill',y='tip',data=tips,col='day',hue='sex',palette='coolwarm',
          aspect=0.6,size=8)
/home/ggilmore/.local/lib/python3.6/site-packages/seaborn/regression.py:546: UserWarning: The `size` paramter has been renamed to `height`; please update your code.
  warnings.warn(msg, UserWarning)


<seaborn.axisgrid.FacetGrid at 0x7f62f008ef98>
You’re probably wondering how to change the font size or control the aesthetics even more, check out the Style and Color Lecture and Notebook for more info on that!
Greydon Gilmore
Intraoperative Neurophysiologist Biomedical Engineer
My research interests include deep brain stimulation, machine learning and signal processing.