Grids Plots
Grids are general types of plots that allow you to map plot types to rows and columns of a grid, this helps you create similar plots separated by features.
import seaborn as sns
import matplotlib.pyplot as plt
%matplotlib inline
iris = sns.load_dataset('iris')
iris.head()
| sepal_length | sepal_width | petal_length | petal_width | species | |
|---|---|---|---|---|---|
| 0 | 5.1 | 3.5 | 1.4 | 0.2 | setosa |
| 1 | 4.9 | 3.0 | 1.4 | 0.2 | setosa |
| 2 | 4.7 | 3.2 | 1.3 | 0.2 | setosa |
| 3 | 4.6 | 3.1 | 1.5 | 0.2 | setosa |
| 4 | 5.0 | 3.6 | 1.4 | 0.2 | setosa |
PairGrid
Pairgrid is a subplot grid for plotting pairwise relationships in a dataset.
# Just the Grid
sns.PairGrid(iris)
<seaborn.axisgrid.PairGrid at 0x7f00d6bfccf8>
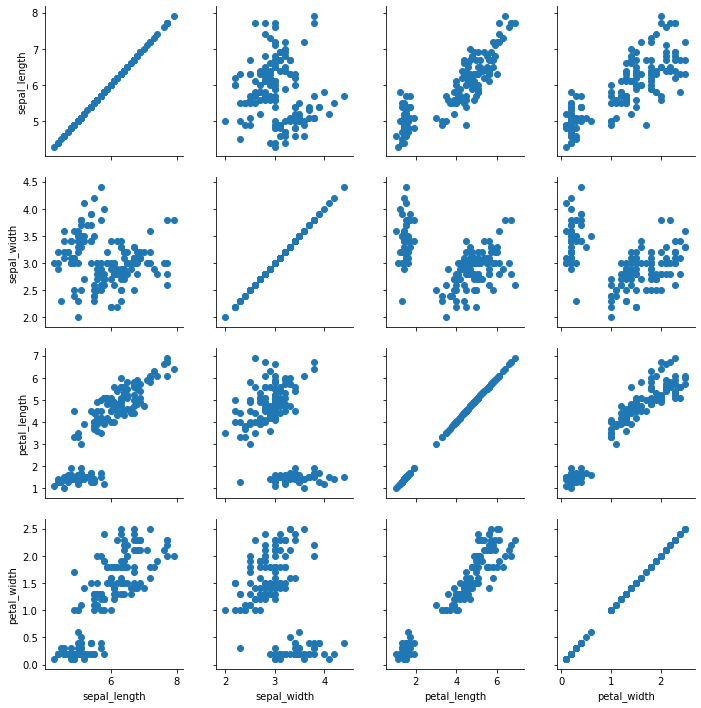
# Then you map to the grid
g = sns.PairGrid(iris)
g.map(plt.scatter)
<seaborn.axisgrid.PairGrid at 0x7f00d3ccf898>
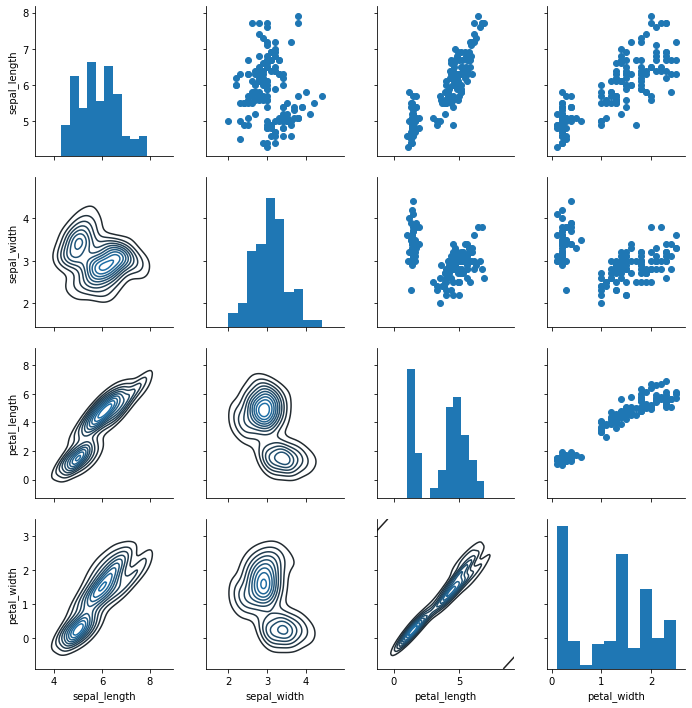
# Map to upper,lower, and diagonal
g = sns.PairGrid(iris)
g.map_diag(plt.hist)
g.map_upper(plt.scatter)
g.map_lower(sns.kdeplot)
<seaborn.axisgrid.PairGrid at 0x7f00d30b4978>
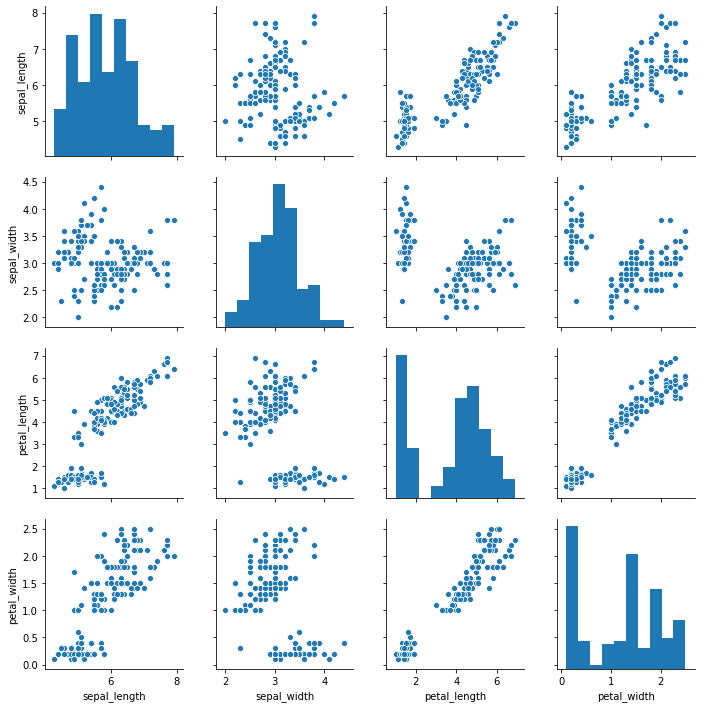
pairplot
pairplot is a simpler version of PairGrid (you’ll use quite often)
sns.pairplot(iris)
<seaborn.axisgrid.PairGrid at 0x7f00d0f46fd0>
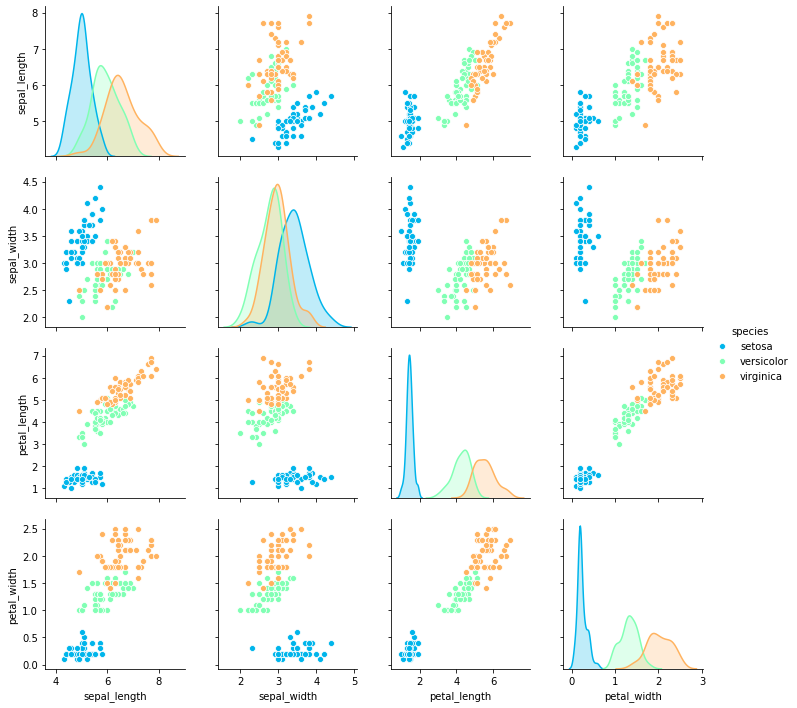
sns.pairplot(iris,hue='species',palette='rainbow')
<seaborn.axisgrid.PairGrid at 0x7f00d0925908>
Facet Grid
FacetGrid is the general way to create grids of plots based off of a feature:
tips = sns.load_dataset('tips')
tips.head()
| total_bill | tip | sex | smoker | day | time | size | |
|---|---|---|---|---|---|---|---|
| 0 | 16.99 | 1.01 | Female | No | Sun | Dinner | 2 |
| 1 | 10.34 | 1.66 | Male | No | Sun | Dinner | 3 |
| 2 | 21.01 | 3.50 | Male | No | Sun | Dinner | 3 |
| 3 | 23.68 | 3.31 | Male | No | Sun | Dinner | 2 |
| 4 | 24.59 | 3.61 | Female | No | Sun | Dinner | 4 |
# Just the Grid
g = sns.FacetGrid(tips, col="time", row="smoker")
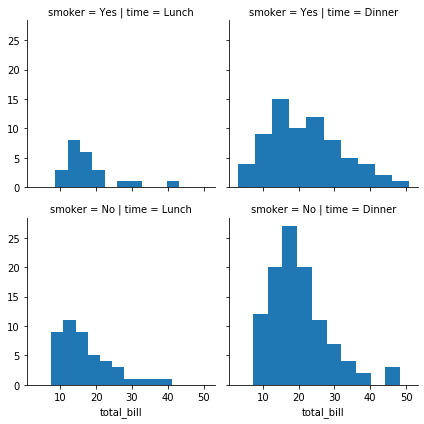
g = sns.FacetGrid(tips, col="time",  row="smoker")
g = g.map(plt.hist, "total_bill")
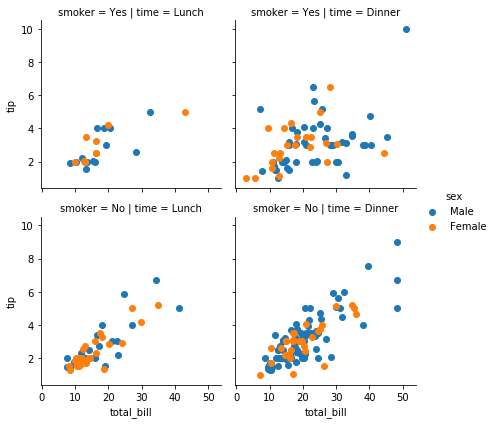
g = sns.FacetGrid(tips, col="time",  row="smoker",hue='sex')
# Notice hwo the arguments come after plt.scatter call
g = g.map(plt.scatter, "total_bill", "tip").add_legend()
JointGrid
JointGrid is the general version for jointplot() type grids, for a quick example:
g = sns.JointGrid(x="total_bill", y="tip", data=tips)
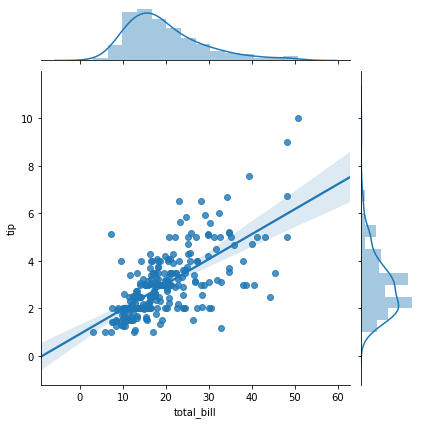
g = sns.JointGrid(x="total_bill", y="tip", data=tips)
g = g.plot(sns.regplot, sns.distplot)
Reference the documentation as necessary for grid types, but most of the time you’ll just use the easier plots discussed earlier.
Greydon Gilmore
Intraoperative Neurophysiologist Biomedical Engineer
My research interests include deep brain stimulation, machine learning and signal processing.